
 Pycharm atplotlib.pyplot图像不显示解决方法
原文链接:https://blog.csdn.net/qq_39355828/article/details/117481909 (opens new window) 1.使用下面可以使得图像独立显示,
import matplotlib.pyplot as plt
matplotlib.use('TkAgg')
1
2
2
则会独立显示:
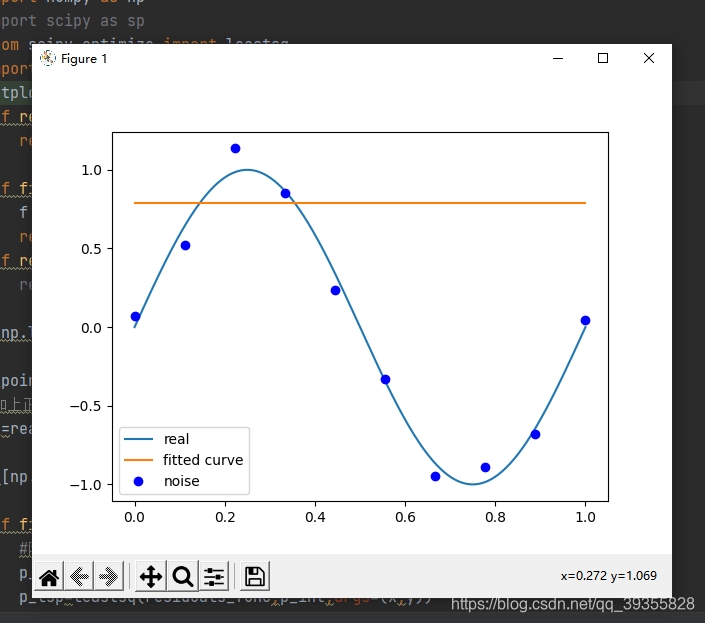
plt.plot(x_points,real_func(x_points),label='real')

    plt.plot(x_points,fit_func(p_lsp[0],x_points),label='fitted curve')

    plt.plot(x,y,'bo',label='noise')
1
2
3
4
5
2
3
4
5
不会对图像进行显示 图像显示 应该增加 :
plt.show()
1
编辑 (opens new window)
上次更新: 2026/08/11, 13:36:18